Sample reports
Sample reports — choose the one closest to your situation
“We report the numbers every month” means little until you have seen one. Pick the report closest to your situation and we will email you the six-page PDF. The figures are synthetic; the structure, the KPI definitions and the way findings are written are exactly what our clients receive each month.
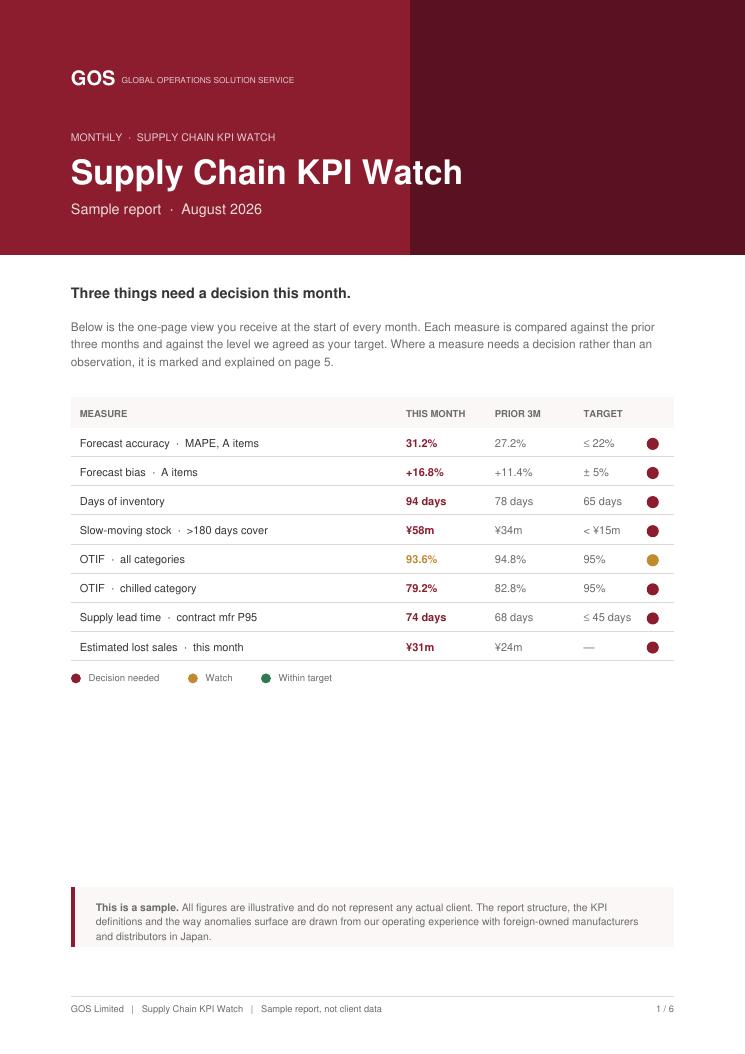
For manufacturers and distributors in Japan, and head offices without a planner on the ground
Supply Chain KPI Watch
Stock keeps growing and stock-outs continue; forecasts keep missing. Eight measures show why it is one problem, not three.
- What it measuresForecast accuracy (MAPE, bias) · days of inventory and slow-moving stock · OTIF · supply lead time (mean and P95) · estimated lost sales
- Findings in the sampleForecasts for the top SKUs have been high for five months · The average hides a failure in the chilled category · The contract manufacturer is stable on average, unstable in fact
- Next actionsRe-size safety stock on P95, put bias correction into the monthly cycle, review slow-moving stock SKU by SKU
- What followsKPI Watch (monthly) · Supply Chain Health Check (one-off)
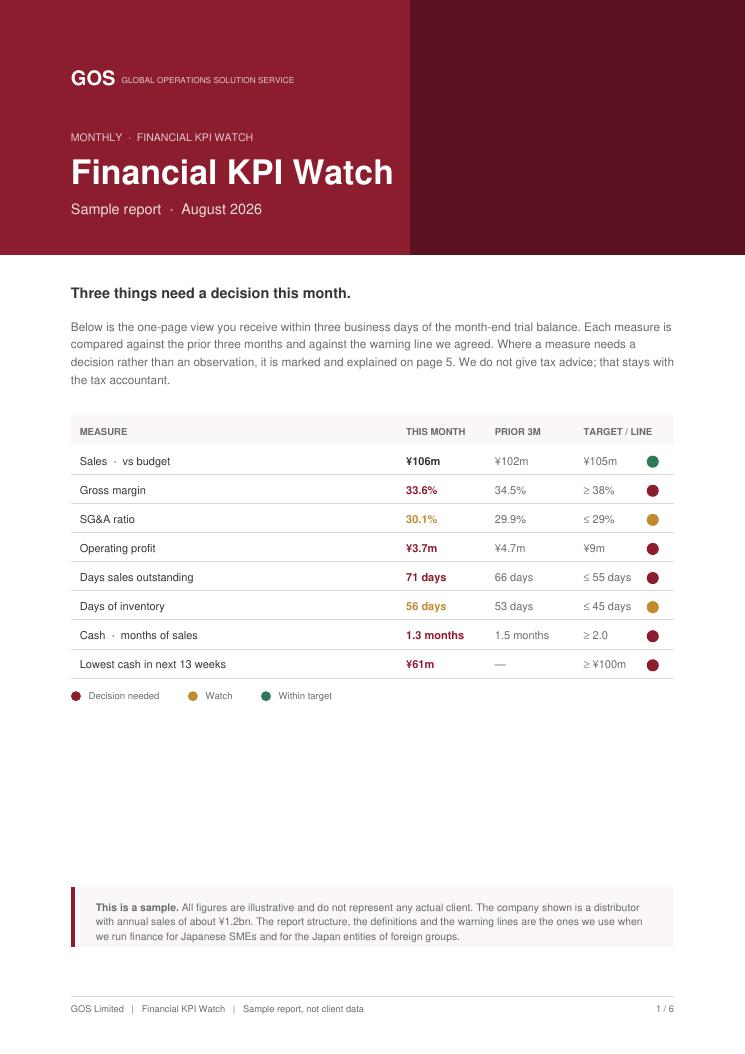
For owners and head offices who receive the monthly trial balance but not the decisions it calls for
Financial KPI Watch
Profitable, yet cash is falling. Margin, collection and cash are read as one line, ending in what to decide next. No tax advice.
- What it measuresSales, gross margin, SG&A, operating profit · days sales outstanding · days of inventory · cash in months of sales · 13-week cash forecast
- Findings in the samplePurchase price increases are not being passed on; margin down five months running · Three late payers have added nineteen days to receivables · Cash reaches 0.6 months of sales in week 9 while the company is profitable
- Next actionsA rolling 13-week cash forecast, a company pricing rule, collection steps and credit rules
- What followsFinancial KPI Watch (monthly) · management advisory
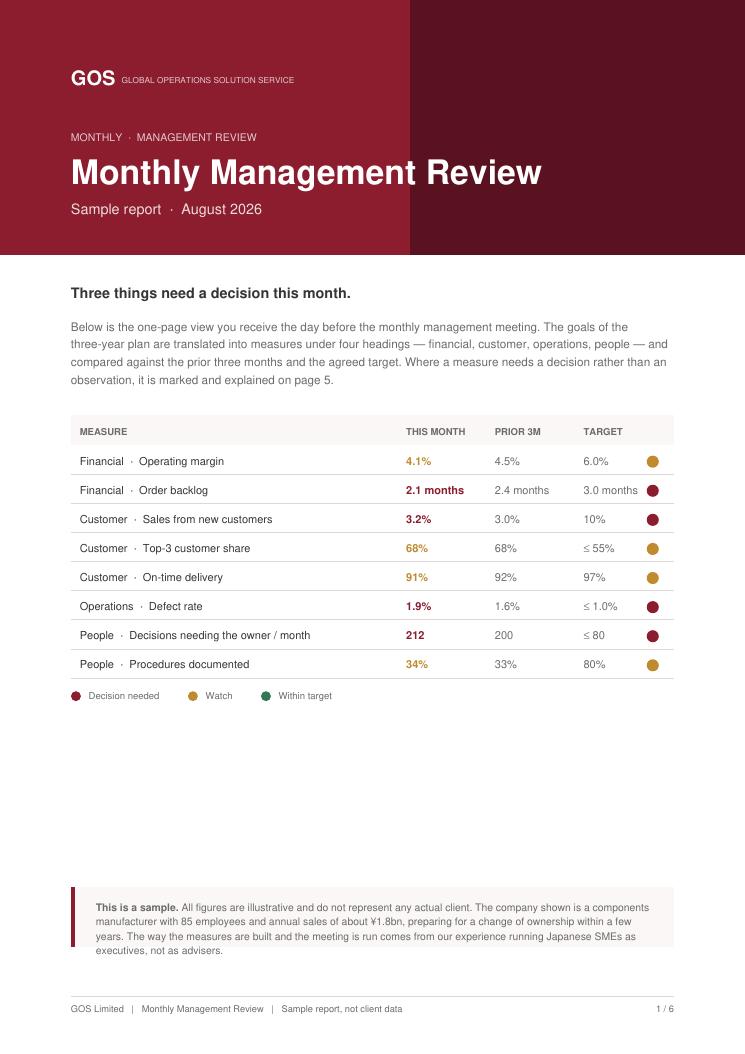
For owner-managers whose strategy is clear but whose company does not move, and who are preparing to hand over
Monthly Management Review
The three-year plan is translated into financial, customer, operational and people measures, and carried into the monthly meeting as decisions to take.
- What it measuresOperating margin, order backlog · new-customer share, top-3 concentration, on-time delivery · defect rate · decisions needing the owner, procedures documented
- Findings in the sampleThe new-business goal is nobody’s target · Inspection on the new line depends on the person; defects have doubled · Decisions concentrate on the owner; the company cannot yet be handed over
- Next actionsWrite the inspection procedure, connect new-business KPIs to individual targets, revise the authority rules
- What followsManagement advisory, premium or executive (monthly)
One format
All three are written to the same six pages
Different reports, one way of reading them: definitions that do not change from month to month, findings stated as what we see, what it costs and why, and next actions limited to three.
| Page 1 | This month’s summary Eight measures shown as this month / prior three months / target, with the ones needing a decision marked. |
|---|---|
| Pages 2–4 | Each measure, read The trend, and what the current level is costing. Every page states how the measure is calculated. |
| Page 5 | Three findings What we see, what it costs, why it is happening — ranked by how soon the window to act closes. |
| Page 6 | Three next actions, and how this works How long each takes if we carry it out, and what we need from you monthly. We do not bill by the hour. |
Tick the report(s) you want on the contact form and send it. The automated confirmation email carries the PDF link(s). We do not follow up by phone; if you have a question, write it in the message field.